Reading the Common Data Set
When you’re in the business of college admissions, the most difficult question to answer is, “Do you think I’ll get in?” That’s also the question we get most frequently. While we can’t predict the future (and you know what people say about assuming), we can use the information provided to us to make reasonable predictions. Luckily, the Common Data Set is stock full of information that can help us do this.

Most schools publish a Common Data Set annually, which provides key, up-to-date information about their institution. Publishers ask each school the same core questions, simplifying your process of comparing and contrasting different schools. Participating colleges and universities (typically) publish their responses on their websites.
The Common Data Set can tell you a lot. They can tell you things like how much importance a college places on class rank, SAT/ACT scores, and GPA, what percentage of men and women are accepted, what kind of financial aid they can offer, and so on. Long story short, the Common Data Set is the best tool when trying to figure out the acceptance rate for your specific situation, rather than simply the overall acceptance rate.
We’ll show you how to locate and read a school’s Common Data Set!
.
Step #1: Google the Common Data Set of the school you’re interested in.
Let’s use my alma mater for our example. To find Vanderbilt’s Common Data Set, I’ll go to all-powerful Google and search, “Common Data Set Vanderbilt.” Makes sense, right? The very first result takes us to the Common Data Set for Vanderbilt University.

.
Step #2: Locate the proper section.
There’s a scroll-down menu at the top that lists every section of Vanderbilt’s Common Data Set. We will start here:
![]()
This will give us all of the information we want to know about gaining admission as a first-year student.
Right off the bat, we see the total application and acceptance numbers. 14,208 men applied and 1,617 men were accepted. 17,254 women applied, and 1,798 women were accepted. Of those numbers, 756 men and 850 women enrolled.
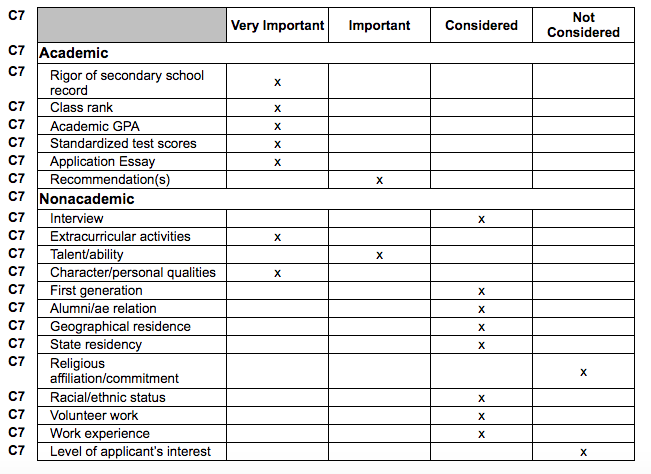
In my opinion, the most illuminating part of this section falls under the heading “Basis for Selection.” Here, we can read a list of the “relative importance of each of the following academic and nonacademic factors in first-time, first-year, degree-seeking (freshman) admissions decisions.” In other words, we’re given a list of every factor that goes into a college application and how much the admissions counselors at Vanderbilt actually care about it!

Reading this table can help you figure out if you’ve got what the school is looking for or not. As you can see, Vanderbilt prioritizes things like class rank, GPA, the academic rigor of the courses you took in high school, test scores, extracurriculars, and character. They don’t even consider demonstrated interest (“level of applicant’s interest”). Recommendation letters are important, while volunteer and work experience is considered but not prioritized.
As you can see, you can learn a lot about what the school looks for just by checking out this table on each school’s website! It can also tell you what not to waste your time on. For example, since Vanderbilt doesn’t care about demonstrated interest, I wouldn’t stress myself out trying to attend every college fair and introduce myself to everyone on the campus tour.
Note the lines that say “Geographical residence” and “State residency” as well. According to this example, Vanderbilt takes both into consideration. If you’re from a region that isn’t well represented at the school, you’ve statistically got a better chance of being accepted!
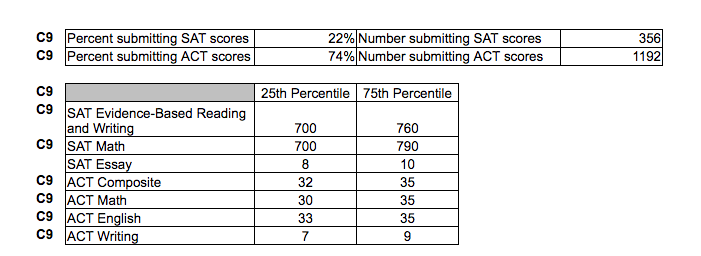
Further down, you can also see the average test scores of admitted and enrolled freshmen. They break down the average SAT and ACT section scores. This is a handy tool to see how you measure up. If your scores are lower than the average, you may want to focus your energy on raising those scores.

The Common Data Set can be an intimidating tool to use simply because of how much information it provides, but it is truly one of the best ways to learn more about the colleges you’re considering. Not only does it give you information about your acceptance probability, it also highlights things like tuition costs, majors offered, financial aid, and even student life. When in doubt… consult the Common Data Set!


